Monthly Archives: April 2013

Journal Club: Evolutionary conservation of codon optimality reveals hidden signatures of cotranslational folding

This paper Pechmann et al discusses the relationship between codons and co-translational regulation of protein folding.  Every amino acid apart from Methionine and Tryptophan has multiple codons and it is well established that codons are translated at varying speeds and thus influence local translational kinetics.

Translation

This codon multiplicity and speed variation may be important for protein folding as several experiments have shown that synonymous substitutions (changing the codon but not the amino acid) alter folding and or function.

codon translation efficeincy depends on tRNA supply and demand

codon translation efficeincy depends on tRNA supply and demand

The new idea presented in this paper is a translational efficiency scale. This is an attempt to calculate the efficiency with which a codon will be translated by considering both the supply of tRNA and the demand for that tRNA. They calculate their new measure nTE for all of the coding sequences in 10 closely related yeast species.

The distribution of the nTE values is unlike that of previous scales as the majority of codons occur in a middle plateau region. The authors suggest that this is due to cost effective proteome maintenance, i.e. for most tRNA supply and demand are closely matched.

They go on to look for the previously observed “ramp” a slow region at the start of coding sequences. They identify a ramp region which is approximately 10 codons long (this is significantly shorter than that seen in other analyses which found a 35-50 codon ramp). This shorter region relates to two other observations, firstly the distance between the peptidyl transferase centre and the constriction site in the ribosome is approximately 10 amino acids long and secondly that experimentally ribosomes are found to pause near the very start of coding sequences.

The codons are now divided into two categories based on their nTE score, optimal codons those with high nTE values that should be translated rapidly and accurately and non-optimal codons. The authors found that codon optimality was conserved between orthologs in their set at rates far higher than those expected by chance (for both optimal and non-optimal codons). When considering those proteins with structural information available, they were also able to observe conservation of positioning of codon types with respect to secondary structures. This evolutionary conservation suggests an evolved function for codon optimality in regulating the rhythm of elongation in order to facilitate co-translational protein folding.


Evolutionary conservation of codon optimality reveals hidden signatures of cotranslational folding Nat Struct Mol Biol. 2013 Feb;20(2):237-43 Pechmann S,  Frydman J.

Constrain a PDB to particular chains

In many applications you need to constrain PDB files to certain chains. You can do it using this program.

A. What does it do?

Given a pdb file, write out the ATOM and HETATM entries for the supplied chain(s).

PDB_constrain needs three arguments:

  1. PDB file to constrain.
  2. Chains from the pdb file to constrain.
  3. Output file.

B. Requirements:

Biopython – should be installed on your machines but in case you want to use it locally, download the latest version into the PDB_constrain.py’s directory (don’t need to build).

C. Example use:

C.1 Constrain 1A2Y.pdb to chains A and B – write results in constr.pdb

python PDB_constrain.py -f 1A2Y.pdb -c AB -o const.pdb


C.2 Constrain 1ACY to chain L, write results in const.pdb – this example shows that the constrainer works well with ‘insertion’ residue numbering as in antibodies where you have 27A, 27B etc.

python PDB_constrain.py -f 1ACY.pdb -c L -o const.pdb


Making small molecules look good in PyMOL

Another largely plagiarized post for my “personal notes” (thanks Justin Lorieau!) and following on from the post about pretty-fication of macromolecules.  For my slowly-progressing confirmation report I needed some beautiful small molecule representation.  Here is some PyMOL code:

show sticks
set ray_opaque_background, off
set stick_radius, 0.1
show spheres
set sphere_scale, 0.15, all
set sphere_scale, 0.12, elem H
color gray40, elem C
set sphere_quality, 30
set stick_quality, 30
set sphere_transparency, 0.0
set stick_transparency, 0.0
set ray_shadow, off
set orthoscopic, 1
set antialias, 2
ray 1024,768

And the result:

ligand

Beautiful, no?

Viewing ligands in twilight electron density

In this week’s journal club we discussed an excellent review paper by E. Pozharski, C. X. Weichenberger and B. Rupp investigating crystallographic approaches to protein-ligand complex elucidation. The paper assessed and highlighted the shortcomings of deposited PDB structures containing ligand-protein complexes. It then made suggestions for the community as a whole and for researchers making use of ligand-protein complexes in their work.

The paper discussed:

  • The difficulties in protein ligand complex elucidation
  • The tools to assess the quality of protein-ligand structures both qualitative and quantitative
  • The methods used describing their analysis of certain PDB structures
  • Some case studies visually demonstrating these issues
  • Some practical conclusions for the crystallographic community
  • Some practical conclusions for non-crystallographer users of protein-ligand complex structures from the PDB

The basic difficulties of ligand-protein complex elucidation

  • Ligands have less than 100% occupancy – sometimes significantly less and thus will inherently show up less clearly in the overall electron density.
  • Ligands make small contributions to the overall structure and thus global quality measures , such as r-factors, will be affected only minutely by the ligand portion of the structure being wrong
  • The original basis model needs to be used appropriately. The r-free data from the original APO model should be used to avoid model bias

The following are the tools available to inspect the quality of agreement between protein structures and their associated data.

  • Visual inspection of the Fo-Fc and 2Fo-Fc maps,using software such as COOT, is essential to assess qualitatively whether a structure is justified by the evidence.
  • Use of local measures of quality for example real space correlation coefficients (RSCC)
  • Their own tool, making use of the above as well as global quality measure resolution

Methods and results

In a separate publication they had analysed the entirety of the PDB containing both ligands and published structure factors. In this sample they demonstrate 7.6% had RSCC values of less than 0.6 the arbitrary cut off they use to determine whether the experimental evidence supports the model coordinates.

Figure to show an incorrectly oriented ligand (a) and its correction (b)

An incorrectly oriented ligand (a) and its correction (b). In all of these figures Blue is the 2mFoDFc map contoured at 1σ and Green and Red are positive and negative conturing of the mFoDFc map at 3σ

In this publication they visually inspected a subset of structures to assess in more detail how effective that arbitrary cutoff is and ascertain the reason for poor correlation. They showed the following:

(i) Ligands incorrectly identified as questionable,false positives(7.4%)
(ii) Incorrectly modelled ligands (5.2%)
(iii) Ligands with partially missing density (29.2%).
(iv) Glycosylation sites (31.3%)
(v) Ligands placed into electron density that is likely to
originate from mother-liquor components
(vi) Incorrect ligand (4.7%)
(vii) Ligands that are entirely unjustified by the electron
density (11.9%).

The first point on the above data is that the false-positive rate using RSCC of 0.6 is 7.4%. This demonstrates that this value is not sufficient to accurately determine incorrect ligand coordinates. Within the other categories all errors can be attributed to one of or a combination of the following two factors:

  • The inexperience of the crystallographer being unable to understand the data in front of them
  • The wilful denial of the data in front of the crystallographer in order that they present the data they wanted to see
Figure to show a ligand placed in density for a sulphate ion from the mother liquor (a) and it's correction (b)

A ligand incorrectly placed in density for a sulphate ion from the mother liquor (a) and it’s correction (b)

The paper observed that a disproportionate amount of poor answers was derived from glycosylation sites. In some instances these observations were used to inform the biochemistry of the protein in question. Interestingly this follows observations from almost a decade ago, however many of the examples in the Twilight paper were taken from 2008 or later. This indicates the community as a whole is not reacting to this problem and needs further prodding.

Figure to show an incomplete glycosylation site inaccurately modeled

Figure to show an incomplete glycosylation site inaccurately modeled

Conclusions and suggestions

For inexperienced users looking at ligand-protein complexes from the PDB:

  • Inspect the electron density map using COOT if is available to determine qualitatively is their evidence for the ligand being there
  • If using large numbers of ligand-protein complexes, use a script such as Twilight to find the RSCC value for the ligand to give some confidence a ligand is actually present as stated

For the crystallographic community:

  • Improved training of crystallographers to ensure errors due to genuine misinterpretation of the underlying data are minimised
  • More submission of electron-density maps, even if not publically available they should form part of initial structure validation
  • Software is easy to use but difficult to analyse the output

GPGPUs for bioinformatics

As the clock speed in computer Central Processing Units (CPUs) began to plateau, their data and task parallelism was expanded to compensate. These days (2013) it is not uncommon to find upwards of a dozen processing cores on a single CPU and each core capable of performing 8 calculations as a single operation. Graphics Processing Units were originally intended to assist CPUs by providing hardware optimised to speed up rendering highly parallel graphical data into a frame buffer. As graphical models became more complex, it became difficult to provide a single piece of hardware which implemented an optimised design for every model and every calculation the end user may desire. Instead, GPU designs evolved to be more readily programmable and exhibit greater parallelism. Top-end GPUs are now equipped with over 2,500 simple cores and have their own CUDA or OpenCL programming languages. This new found programmability allowed users the freedom to take non-graphics tasks which would otherwise have saturated a CPU for days and to run them on the highly parallel hardware of the GPU. This technique proved so effective for certain tasks that GPU manufacturers have since begun to tweak their architectures to be suitable not just for graphics processing but also for more general purpose tasks, thus beginning the evolution General Purpose Graphics Processing Unit (GPGPU).

Improvements in data capture and model generation have caused an explosion in the amount of bioinformatic data which is now available. Data which is increasing in volume faster than CPUs are increasing in either speed or parallelism. An example of this can be found here, which displays a graph of the number of proteins stored in the Protein Data Bank per year. To process this vast volume of data, many of the common tools for structure prediction, sequence analysis, molecular dynamics and so forth have now been ported to the GPGPU. The following tools are now GPGPU enabled and offer significant speed-up compared to their CPU-based counterparts:

Application Description Expected Speed Up Multi-GPU Support
Abalone Models molecular dynamics of biopolymers for simulations of proteins, DNA and ligands 4-29x No
ACEMD GPU simulation of molecular mechanics force fields, implicit and explicit solvent 160 ns/day GPU version only Yes
AMBER Suite of programs to simulate molecular dynamics on biomolecule 89.44 ns/day JAC NVE Yes
BarraCUDA Sequence mapping software 6-10x Yes
CUDASW++ Open source software for Smith-Waterman protein database searches on GPUs 10-50x Yes
CUDA-BLASTP Accelerates NCBI BLAST for scanning protein sequence databases 10 Yes
CUSHAW Parallelized short read aligner 10x Yes
DL-POLY Simulate macromolecules, polymers, ionic systems, etc on a distributed memory parallel computer 4x Yes
GPU-BLAST Local search with fast k-tuple heuristic 3-4x No
GROMACS Simulation of biochemical molecules with complicated bond interactions 165 ns/Day DHFR No
GPU-HMMER Parallelized local and global search with profile Hidden Markov models 60-100x Yes
HOOMD-Blue Particle dynamics package written from the ground up for GPUs 2x Yes
LAMMPS Classical molecular dynamics package 3-18x Yes
mCUDA-MEME Ultrafast scalable motif discovery algorithm based on MEME 4-10x Yes
MUMmerGPU An open-source high-throughput parallel pairwise local sequence alignment program 13x No
NAMD Designed for high-performance simulation of large molecular systems 6.44 ns/days STMV 585x 2050s Yes
OpenMM Library and application for molecular dynamics for HPC with GPUs Implicit: 127-213 ns/day; Explicit: 18-55 ns/day DHFR Yes
SeqNFind A commercial GPU Accelerated Sequence Analysis Toolset 400x Yes
TeraChem A general purpose quantum chemistry package 7-50x Yes
UGENE Opensource Smith-Waterman for SSE/CUDA, Suffix array based repeats finder and dotplot 6-8x Yes
WideLM Fits numerous linear models to a fixed design and response 150x Yes

It is important to note however, that due to how GPGPUs handle floating point arithmetic compared to CPUs, results can and will differ between architectures, making a direct comparison impossible. Instead, interval arithmetic may be useful to sanity-check the results generated on the GPU are consistent with those from a CPU based system.

PredyFlexy – Predicting Protein Flexibility

PredyFlexyResulteg

An example output of PredyFlexy

My presentation focused on a method to predict protein flexibility – PredyFlexy. There is a webserver, and it is described in their paper (de Brevern et. al 2012). The method is covered much more explicitly in the paper Predicting protein flexibility through the prediction of local structures (Bornot et al. 2011). This work builds on earlier papers (which are mentioned on the front page of the webserver, some of which I will mention later). In terms of people, Alexandre G. de Brevern, Aurelie Bornot, and Catherine Etchebest are authors common to all of these papers.

The concept is simple; there is a library of ‘Local Structure Prototypes’ or LSPs. These LSPs are 11 residue fragments, and have structure and flexibility associated with them, which are derived from a set of protein structures and molecular dynamics simulations. Each LSP has a SVM (support vector machine) ‘expert’ to score how likely a given sequence profile is to have said structure. A 21 residue window is used to determine the LSP of the central 11 residues within this window.

So, the user inputs a sequence, which gets Psi-Blasted to give a sequence profile. The 5 most probable LSPs for each atom are determined using the SVM experts. Then the predicted flexibility of each atom is given by the average flexibility of these 5 LSPs. There is a confidence index to the predictions, which comes from assessing the discriminative power of the SVMs. Regions predicted to have LSP with more accurate SVMs will have a high confidence index.

Local Structure Prototypes!

Examples of Local Structure Prototypes. Taken from the supplementary information of ‘Predicting protein flexibility through the prediction of local structures’ – Aurélie Bornot, Catherine Etchebest, Alexandre G. de Brevern, Proteins 79, 3, 839–852, 2011

So, the concept seems simple, but you are probably wondering, what are these LSPs? To answer that, we have to delve into the literature. ‘Bayesian probabilistic approach for predicting backbone structures in terms of protein blocks‘, published in 2000, and with Alexandre G. de Brevern as first author, is the sensible place to start. This introduced the concept of protein blocks, which is in effect a structural alphabet. These are 5 residue fragments (described by 8 dihedral angles), and there are 16 of them (there are pretty pictures in the supplementary data 1 of this paper). Local structure prototypes are made up of these protein blocks, which were first used to predict structure, in a 2006 paper – Assessing a Novel Approach for Predicting Local 3D Protein Structures from Sequence (again, with the same authors). LSPs are 11 residue fragments, made from 7 overlapping protein blocks. Obviously there are lots of combinations to the protein blocks that can give 11 residue fragments. These combinations are clustered into 120 groups. Each group is represented by the fragment within the cluster that is closest to all other fragments within the cluster, based on C-alpha RMSD. Hence 120 LSPs.

The other pertinent question is, where does the flexibility data come from? Well, they did some MD simulations (see Bornot et al. 2011 for details) and took b-factors from the structures. They normalised these, by calculating the number of standard deviations away from the mean for each structure. Each LSP was attributed a b-factor and RMSF, which was the mean value for the central residue of every instance of the LSP in the data set. Additionally, each fragment in the data set was  classed as ‘rigid’, ‘flexible’, or ‘intermediate’ based on its normalized RMSF and B-factor. Each LSP was given a probability of belonging to each of these classes based on the frequency of fragments that belonged to that LSP being in each class. The figure here (taken from Bornot et al. 2011) shows the interesting weak correlation between normalised B-factor and normalised RMSF.


Normalised B-factor values according to normalized RMSF values as determined from molecular dynamics simulations. From Bornot et al 2011. Blue points represent rigid fragments, red flexible ones, and green points intermediate fragments.

Normalised B-factor values according to normalized RMSF values as determined from molecular dynamics simulations. From Bornot et al 2011. Blue points represent rigid fragments, red flexible ones, and green points intermediate fragments.

Bornot et al. 2011 also gives us a guide to the ability of this prediction method (see table II). In predicting the class of fragments (rigid, intermediate or flexible), it gets the correct class about half the time. For 40% of rigid and flexible cases, the class is predicted as ‘intermediate’. Prediction rate is also strongly correlated with flexibility – more flexible regions have much poorer prediction rates. Which is not great, as we already know that most alpha helices are rigid. However, the confidence index does give a good guide as to what to trust. I could speculate that might results in an output that tells us that helices and sheets are definitely rigid, and other elements are possibly flexible. Which would not be particularly useful, but given there are few comparable tools, something is better than nothing. 

Protein flexibility is hard; experimentally determining it is difficult (and even MD simulations take a while), and people can argue about how relevant the experimental methods are (and we frequently do in our group meetings). So, like most predictive methods, a relatively fast (and simple) way to get some information about your problem is always going to be useful. If only to guide you to where you might focus your attention.


Journal club: Simultaneous Femtosecond X-ray Spectroscopy and Diffraction of Photosystem II at Room Temperature

In the last journal club we covered the paper Simultaneous Femtosecond X-ray Spectroscopy and Diffraction of Photosystem II at Room Temperature (Kern et al., 2013), currently still in Science Express.

Structure of Photosystem II

Structure of Photosystem II, PDB 2AXT
CC BY-SA 3.0 Curtis Neveu

This paper describes an experiment on the Photosystem II (PSII) protein complex. PSII is a large protein complex consisting of about 20 subunits with a combined weight of ca. 350 kDa. As its name suggests, this complex plays a crucial role in photosynthesis: it is responsible for the oxidation (“splitting up”) of water.

In the actual experiment (see the top right corner of Figure 1 in the paper) three experimental methods are combined: PSII microcrystals (5-15µm) are injected from the top into the path of an X-ray pulse (blue). Simultaneously, an emission spectrum is recorded (yellow, detector at the bottom). And finally in a separate run the injected crystals are treated (‘pumped’) with a visible laser (red) before they hit the X-ray pulse.

Let’s take a look at each of those three in a little more detail.

X-ray diffraction (XRD)

In a standard macromolecular X-ray crystallography experiment a crystal containing identical molecules of interest (protein) at regular, ordered lattice points is exposed to an X-ray beam. Some X-rays are elastically scattered and cause a diffraction pattern to form on a detector. By analysing the diffraction patterns of a rotating crystal it is possible to calculate the electron density distribution of the molecule in question, and thus determine its three dimensional structure.

An intense X-ray beam however also systematically damages the sample (Garman, 2010). For experiments using in-house X-ray generators or synchrotrons it is therefore recommended not to exceed a total dose of 30 MGy on any one crystal (Owen et al., 2006).

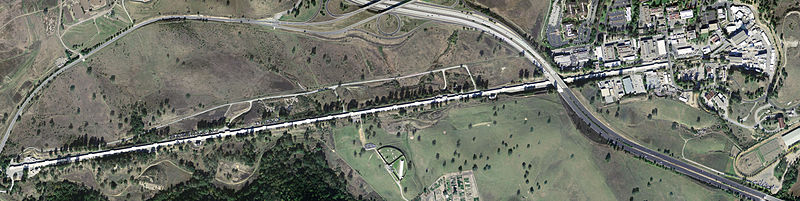
Aerial view of the LCLS site. The accelerator is 3.2 kilometres long.

The experiment described in the current paper however was not conducted using a run-of-the-mill synchrotron, but with the Linac Coherent Light Source (LCLS), an X-ray free electron laser. Here each diffraction image results from an individual crystal exposed to a single X-ray pulse of about 50 femtoseconds, resulting in a peak dose of ~150 MGy. Delivering these extreme doses in very short X-ray pulses lead to the destruction of the sample via a coulomb explosion.

As the sample is destroyed only one diffraction image can be taken per crystal. This causes two complications: Firstly, a large number of sample crystals are required. This explains why the experiment required a total beam time of 6 hours and involved over 2.5 million X-ray shots and processing an equal number of diffraction images. Secondly, the resulting set of (usable) diffraction images are an unordered, random sampling of the crystal orientation space. This presents a computational challenge unique to XFEL setups: before the diffraction data can be integrated, the orientation of the crystal lattice needs to be determined for each individual diffraction image.

X-ray diffraction allows us to obtain a electron density map of the entire unit cell, and therefore the entire crystal. But we can only see ordered areas of the crystal. To really see small molecules in solvent channels, or the conformations of side chains on the protein surface they need to occupy the same positions within each unit cell. For most small molecules this is not the case. This is why you will basically never see compounds like PEGs or Glycerol in your electron density maps, even though you used them during sample preparation. For heavy metal compounds this is especially annoying. They disproportionately increase the X-ray absorption (Holton, 2009; with a handy table 1) and therefore shorten the crystal’s lifetime. But they do not contribute to the diffraction pattern (And that is why you should back-soak; Garman & Murray, 2003).

X-ray emission spectroscopy (XES)

PSII contains a manganese cluster (Mn4CaO5). This cluster, as with all protein metallocentres, is known to be highly radiation sensitive (Yano et al., 2005). Apparently at a dose of about 0.75 MGy the cluster is reduced in 50% of the irradiated unit cells.

Diffraction patterns represent a space- and time-average of the electron density. It is very difficult to quantify the amount of reduction from the obtained diffraction patterns. There is however a better and more direct way of measuring the states of the metal atoms: X-ray emission spectroscopy.

Basically the very same events that cause radiation damage also cause X-ray emissions with very specific energies, characteristic for the involved atoms and their oxidation state. An MnIVO2 energy spectrum looks markedly different to an MnIIO spectrum (bottom right corner of Figure 1).

The measurements of XRD and XES are taken simultaneously. But, differently to XRD, XES does not rely on crystalline order. It makes no difference whether the metallocentres move within the unit cell as a result of specific radiation damage. Even the destruction of the sample is not an issue: we can assume that XES will record the state of the clusters regardless of the state of the crystal lattice – up to the point where the whole sample blows up. But at that point we know that due to the loss of long-range order the X-ray diffraction pattern will no longer be affected.

The measurements of XES therefore give us a worst-case scenario of the state of the manganese cluster in the time-frame where we obtained the X-ray diffraction data.

Induced protein state transition with visible laser

Another neat technique used in this experiment is the activation of the protein by a visible laser in the flight path of the crystals as they approach the X-ray interaction zone. With a known crystal injection speed and a known distance between the visible laser and the X-ray pulse it becomes possible to observe time-dependent protein processes (top left corner of Figure 1).

What makes this paper special? (And why is it important to my work?)

It has been theorized and partially known that the collection of diffraction data using X-ray free electron lasers outruns traditional radiation damage processes. Yet there was no conclusive proof – up until now.

This paper has shown that the XES spectra of the highly sensitive metallocentres do not indicate any measurable (let alone significant) change from the idealized intact state (Figure 3). Apparently the highly sensitive metallocentres of the protein stay intact up to the point of complete sample destruction, and certainly well beyond the point of sample diffraction.

Or to put another way: even though the crystalline sample itself is destroyed under extreme conditions, the obtained diffraction pattern is – for all intents and purposes – that of an intact, pristine, zero dose state of the crystal.

This is an intriguing result for people interested in macromolecular crystallography radiation damage. In a regime of absurdly high doses, where the entire concept of a ‘dose’ for a crystal breaks down (again), we can obtain structural data with no specific radiation damage present at the metallocentres. As metallocentres are more susceptible to specific radiation damage it stands to reason that the diffraction data may be free of all specific damage artefacts.

It is thought that most deposited PDB protein structures containing metallocentres are in a reduced state. XFELs are being constructed all over the world and will be the next big thing in macromolecular crystallography. And now it seems that the future of metalloproteins got even brighter.

Good looking proteins for your publication(s)

Just came across a wonderful PyMOL gallery while creating some images for my (long overdue) confirmation report.  A fantastic resource to draw sexy proteins – especially useful for posters, talks and papers (unless you are paying extra for coloured figures!).

It would be great if we had our own OPIG “pymol gallery”.

An example of one of my proteins (1tgm) with aspirin bound to it:

Good looking protein