Category Archives: Uncategorized

Efficient discovery of overlapping communities in massive networks

Detecting overlapping communities is essential to analyzing and exploring natural networks such as social networks, biological networks, and citation networks. However, most existing approaches do not scale to the size of networks that we regularly observe in the real world. In the paper by Gopalan et al. discussed in this week’s group meeting, a scalable approach to community detection is developed that discovers overlapping communities in massive real-world networks. The approach is based on a Bayesian model of networks that allows nodes to participate in multiple communities, and a corresponding algorithm that naturally interleaves subsampling from the network and updating an estimate of its communities.

The model assumes there are K communities and that each node i is associated with a vector of community memberships \theta_i. To generate a network, the model considers each pair of nodes. For each pair (i,j), it chooses a community indicator z_{i \rightarrow j} from the i^{th} node’s community memberships \theta_i and then chooses a community indicator z_{i \leftarrow j} from \theta_j. A connection is then drawn between the nodes with probability \beta if the indicators point to the same community or with a smaller probability \epsilon if they do not.

This model defines a joint probability p(\theta,\beta,z,y) where y is the observed data. To estimate the posterior p(\theta,beta,z | y), the method uses a stochastic variational inference algorithm. This enables posterior estimation using only a sample of all-possible node pairs at each step of the variational inference, making the method applicable to very large graphs (e.g analyzing a large citation network of physics papers shown in the figure below identifies important papers impacting several sub-disciplines).

Community detection in a physics citation network.

Community detection in a physics citation network.

One limitation of the method is that it does not incorporate automatic estimation of the number of communities, which is a general problem with clustering algorithms. Still, enabling sophisticated probabilistic analysis of structure in massive graphs is a significant step forward.

Link

Journal club (Bernhard Knapp): NetMHCIIpan-3.0

This week’s topic of the Journalclub was about the prediction of potential T cell epitopes (=prediction of the binding affinity between peptides and MHC). In this context I presented the latest paper in the NetMHCpan series:

Karosiene E, Rasmussen M, Blicher T, Lund O, Buus S, Nielsen M. NetMHCIIpan-3.0, a common pan-specific MHC class II prediction method including all three human MHC class II isotypes, HLA-DR, HLA-DP and HLA-DQ. Immunogenetics. 2013 Oct;65(10):711-24

The reliable prediction of the peptide/MHC binding affinity is already a scientific aim for several years: Early approaches were based on the concept of anchor residues i.e. those peptide side-chain which are pointing in the direction of the MHC. The next “generation” of methods was matrix based i.e. it was simply counted how likely it is that a specific residue is at peptide position 1, 2, 3, … for binding and non-binding peptides of a specific MHC allele. In the next step methods started to incorporate higher order approaches i.e. positions within the peptide influence each other (e.g. SVM, ANN, …). While such methods are already quite reliable their major limitation is that they can only be trained on the basis of sufficient experimental binding data per allele. Therefore a prediction for alleles with only few experimental peptide binding affinities is not possible or rather poor in quality. This is especially import because there are several thousand HLA alleles: The latest version of the IPD – IMGT/HLA lists for example 1740 HLA Class I A and 2329 HLA Class I B proteins (http://www.ebi.ac.uk/ipd/imgt/hla/stats.html). Some of them are very frequent and others are not but this the aim would be a 100% coverage.

Pan specific approaches go one step further and allow the binding prediction between peptide and an arbitrary MHC allele for which the sequence is known. The NetMHCpan approach is one of them and is based on the extraction of a pseudo sequence (those MHC residues which are in close proximity to the peptide) per MHC allele. Subsequently this MHC pseudo sequence as well as the peptide sequences are encoded using some algorithm e.g. a BLOSUM matrix. Finally the encoded sequences and the experimental binding affinities are fed into an Artificial Neural Network (ANN). For an illustration of the workflow see:

NetMHCpan workflow
http://www.ncbi.nlm.nih.gov/pmc/articles/PMC2981877/bin/1745-7580-6-S2-S3-2.jpg

This approach turned out to be quite successful and (not too much) depending on the allele the area under ROC reaches in average a healthy 0.8x number which is already quite competitive with experimental approaches.

The netMHCpan series has progressed over the last years starting to cover MHC class I in humans (2007) and beyond (2009). Then MHC class II DR (2010) and in the latest version also DP and DQ (2013). With the next paper expected to be about non human MHC class II alleles the prediction of the binding affinity between peptides and pretty much every MHC should be possible.

AH^AH – Alpha Helices Assessed by Humans.

Can you help our research, by sparing about 15 minutes of your time to participate in our crowd-sourcing experiment? Click here!

We have created a game-like web-application to classify protein helices. If you participate it will take you about 15 minutes and afterwards we will show you the relation between your results and all other participants. You do not need any specific training to participate – your natural human puzzle solving skills are sufficient. Try to beat the others!

blog3

We are interested in kinked α-helices in proteins. Kinks are important for protein function, and understanding them will help to treat and design therapies for diseases. One hindrance to our work is that helix kinks are not well defined – there are many helices that are classed as kinked by some scientists, but not by others. Classifying helices as kinked or curved or straight is difficult computationally. There are lots of different way to do it, but they all give different answers. We think that humans can do it better.

Can you help us by sparing about 15 minutes of your time to assess some α-helices? Click here!

Edit: To participate in this, you need to register. While the data will be made anonymous, registration is required for a number of reasons. It allows you to log back in, and view you results at a later date, it gives us a record that you have participated (so that we can acknowledge your help), and it allows us to compare the results from people with different educational backgrounds. There are also some legal reasons, and it is much more simple if we can record that you have agreed to the privacy and cookies policy, and do not have to ask permission every time you return. We will not pass your data on to third parties, and the data is stored securely (and the passwords encrypted).

Wilcoxon-Mann-Whitney test and a small sample size

The Wilcoxon Mann Whitney test (two samples), is a non-parametric test used to compare if the distributions of two populations are shifted , i.e. say f_1(x) =f_2(x+k) 
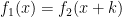
where k is the shift between the two distributions, thus if k=0 then the two populations are actually the same one. This test is based in the rank of the observations of the two samples, which means that it won’t take into account how big the differences between the values of the two samples are, e.g. if performing a WMW test comparing S1=(1,2) and S2=(100,300) it wouldn’t differ of comparing S1=(1,2) and S2=(4,5). Therefore when having a small sample size this is a great loss of information.

Now, what happens when you perform a WMW test on samples of size 2 and 2 and they are as different as they can be (to what the test concerns), lest say S1=(1,2) and S2=(4,5). Then the p-value of this test would be 0.333, which means that the smallest p-value you can obtain from a WMW test when comparing two samples of size 2 and 2 is 0.3333. Hence you would only be able to detect differences between the two samples when using a level of significance greater than 0.333 .

Finally you must understand that having a sample of two is usually not enough for a statistical test. The following table shows the smallest  p-value for different small sample sizes when the alternative hypothesis is two sided. (Values in the table are rounded).

Screen Shot 2015-01-20 at 10.50.56

CABS-flex

One of the still open questions in bioinformatics is that of the flexibility of proteins, and it is one in which I am quite interested. Our main source of structural information is X-ray diffraction experiments, in which the crystalline protein is intrinsically rigid. While there is an ever increasing body of NMR data, and Molecular Dynamics simulations are becoming faster and cheaper, complete information about the dynamics of every PDB structure is a long way off. All atom MD simulations for a complete protein still take either days, or a powerful computer. So, naturally, any papers that talk about ways to get flexibility information catch my attention.

The paper that caught my attention was CABS-flex: Server for fast simulation of protein structure fluctuations.. There also is a connected paper – Consistent View of Protein Fluctuations from All-Atom Molecular Dynamics and Coarse-Grained Dynamics with Knowledge-Based Force-Field – which benchmarks their method against MD simulations.

The CABS model pops up in a number of other places – there is a CABS-fold server, and the method was first described in the paper Consistent View of Protein Fluctuations from All-Atom Molecular Dynamics and Coarse-Grained Dynamics with Knowledge-Based Force-Field from 2004.

What does the webserver do?

You give it a coordinate file, wait some hours, and it gives you back a series of (clustered) structures, a C&alpha trajectory, a residue flexibility profile, and a nice little video. Which is nice. It is, however, a little limited; you can only do a single chain (so no modelling of small molecule or peptide interactions), there is no way of fixing part of the model so it does not flex, and it can be picky about your PDB files – no chain gaps, no strange amino acids. You can tell it to analyse a PDB chain by just entering the code, but these are frequently rejected for having unacceptable coordinate files.

How does it work?

The CABS model makes a reduced representation of the protein, and explores its conformational space by making moves – which are accepted or rejected based on a (comparatively complex) force field. Many moves are attempted, and over a large number of iterations, this builds up an ensemble of structures, which show the possible confirmations of the protein. So, its a bit like MD, but rather than moving atoms based on calculated forces, you make random moves, and accept the sensible ones.

hello

The model is shown above. The protein structure is reduced to 4 atoms per residue. There are 5 types of move, and in each step, a random move of each type is tried ~n times (n being the number of amino acids in the protein). These are accepted or rejected based on their force field, and the process is repeated several hundred times. The force field used to accept/reject moves is quite complex – there are short range (sequence dependent and sequence independent), hydrogen bond, and long range (again, sequence dependent and sequence independent) interactions. There are sub-categories within these, and the relative contributions of the interactions can be changed. There is no solvent, so the long range interactions have to provide the forces to keep the protein together, and the hydrogen bond interactions act to maintain the secondary structure elements. More detail can be found in the 2004 paper.

Is it true?

The authors justify the method by comparing it to MD simulations taken from a database, and conclude that CABS-flex gives answers as similar to MD simulations as MD simulations using different force fields are to each other. Simply put, the same residues move in their simulations as move in MD simulations. They move more, which backs up their claim that they demonstrate flexibility over a longer time-frame than MD simulations. They do admit that they get the best agreement when they heavily restrict their secondary structure – raising the question of how much of the agreement between all of the methods is down to all the simulations having the same secondary structure.

To conclude, this could be a useful method, particularly in that it can give long time-frame flexibility – providing you treat it as any other measure of flexibility, with a pinch of salt. It is a bit of a shame that the interface is (perhaps frustratingly) simple, and you need to pre-process your coordinate files, as many PDB coordinate files will not be accepted.

Conservation of codon optimality

The unidirectional process of translation converts one dimensional mRNA sequences into three dimensional protein structures. The reactant, the mRNA, is built from 64 codon variants, while the product, the protein, is constructed from the 20 biologically relevant amino acids. This reduction of 64 variants to a mere 20 is indicative of the degeneracy contained within the genetic code. Multiple codons encode for the same amino acid, and hence any given protein can be encoded by a multitude of synonymous mRNA sequences.  Current structural biology research often assumes that these synonymous mRNA sequences are equivalent; the ability of certain proteins to unfold and refold without detrimental effects leading to the assumption that the information pertaining to the folded structure is contained exclusively within the protein sequence. In actuality, experimental evidence is mounting that shows synonymous sequences can in fact produce proteins with different properties; synonymous codon switches having been observed to cause a wide range of detrimental effects, such as decreases in enzyme activity, reductions in solubility, and even causing misfolding.

The ribosome (yellow) passes along the mRNA, turning the sequence of codons into a protein. Under our model, the speed of the translation for each codon varies, in turn differing the time available to the nascent peptide chain to explore the fold space. Through this method codon choice becomes an additional source of structural information.

The ribosome (yellow) passes along the mRNA, turning the sequence of codons into a protein. Under our model, the speed of the translation for each codon varies, in turn differing the time available to the nascent peptide chain to explore the fold space. Through this method codon choice becomes an additional source of structural information.

For my 10 week DTC project within the Deane group,  I was tasked with resurrecting the Coding Sequence and Structure database (CSandS; read: Sea Sands) and using it to test for the evolutionary conservation of codon choice over groups of proteins with similar structures. With experimental differences noted in protein product structure between synonymous sequences, we wished to investigate if codon choice is an evolutionary constraint on protein structure, and if so, to what degree, and in what manner. To test for evolutionary conservation we combined the theories of codon optimality and cotranslational folding, our hypothesis being that the choice of codon directly affects the translation efficiency of the ribosome; consequently different codons give the nascent polypeptide emerging from the ribosome varying amounts of time to explore the fold-space.  By assigning optimality scores to each codon, we can search for regions of fast translation and slow translation, then by looking for correlations within aligned sets of structural similar proteins we can identify sites where codon choice is of importance. While the 10 weeks project focussed mainly on methodology and implementation, my preliminary results indicate that a large percentage of proteins are under selective pressures with regards to codon choice. I found that in most sets of proteins, there is an greater amount of correlation than would be expected by chance, this crucially suggests that there is additional structural information contained within the mRNA that is lost once translation occurs.

For additional information on the background, methodology and implementation of this research, please feel free to view the presentation slides at:  http://www.slideshare.net/AlistairMartin/evolut-26981404

Antibody Modelling: CDR-H3 Structure Prediction

As regular readers of this blog will know (I know you’re out there somewhere!), one of the main focusses of OPIG at the moment is antibody structure. For the last ten weeks (as one of my short projects for the Systems Approaches to Biomedical Science program of the DTC) I have been working on predicting the structure of the CDR-H3 loop.

CDRs_rainbow_labelled

So, a quick reminder on antibody structure: antibodies, which have a characteristic shape reminiscent of the letter `Y’, consist of two identical halves, each containing a heavy and a light chain. Heavy chains are made up of four domains (three constant domains, CH1, CH2 and CH3; and one variable domain, VH), while light chains have two (one constant domain, CL; and one variable domain, VL). The variable domains of both the heavy and light chain together are known as the Fv region; most naturally occurring antibodies have two. At the ends of these Fv regions are six loops, known as the complementarity determining regions, or CDRs. There are three CDRs on each of the VH and VL domains; those located on the VL domain are labelled L1, L2 and L3, while those found on the VH domain are labelled H1, H2 and H3. It is these loops that form the most variable parts of the whole antibody structure, and so it is these CDRs that govern the binding properties of the antibody. Of the six CDRs, by far the most variable is the H3 loop, found in the centre of the antigen binding site. A huge range of H3 lengths have been observed, commonly between 3 and 25 residues but occasionally much longer. This creates a much larger structural diversity when compared to the other CDRs, each of which has at most 8 different lengths. It is the H3 loop that is thought to contribute the most to antigen binding properties. Being able to model this loop is therefore an important part of creating an accurate model, suitable for use in therapeutic antibody design.

Predicting the structure of the loop requires three steps: sampling, filtering and ranking. There are two types of loop modelling method, which differ in the way they perform the sampling step: knowledge-based methods, and ab initio methods. Knowledge-based methods, or database methods, rely upon databases of known loop structures that can be searched in order to find fragments that would form feasible structures when placed in the gap. Whilst predictions are made relatively quickly in this way, one disadvantage is that the database of fragments may not contain anything suitable, and in this situation no prediction would be made. Ab initio (or conformational searching) methods, on the other hand, do not rely upon a set of previously known loop structures – loop conformations are generated computationally, normally by sampling dihedral angles from distributions specific to each amino acid. The loops generated in this way, however, are not ‘closed’, i.e. the loop does not attach to both anchor regions, and therefore some sort of loop closure method must be implemented. The assumption is made that the native loop structure should represent the global minimum of the protein’s free energy. Ab initio methods are generally much slower than knowledge-based ones, and their accuracy is dependent on loop length (long loops are harder to predict using this method), however unlike the database methods, an answer will always be produced.

3juyE

For my project, I have examined the performance of FREAD (a knowledge-based method) and MECHANO (an ab initio method) when predicting the structure of the H3 loop. At the moment, FREAD produces better results than MECHANO, however we hope to improve the predictions made by both. By optimising the performance of both methods, we hope to create a ‘hybrid’ loop modelling method, thereby exploiting the advantages of both approaches. Since I’ve decided that this is the project I want to continue with, this will be the aim of my DPhil!

Network Analysis

Why networks?

Individual expression could be thought as a phenomenon regulated mostly by the individual, but in a second stand it is also modified by the interactions with the surroundings.  Can the response of the individual be predicted by the group? (See the following video of an experiment conducted by Asch https://www.youtube.com/watch?v=FnT2FcuZaYI)

networkinside

 Most common type of network analysis

  • Basic network summary statistics (description)
  • Clustering methods (Extract information)
  • Random graphs (Description, inference and to model network topology)
  • Learning machine methods (Prediction)

Random Graphs and the topology structure

Depending on the structure of a desired network different random models could be of use, for example, if the goal is to obtain a sparse and not highly connected network then an ER model could be of use (this model randomly assign the edges between nodes)
or if the goal is exactly the opposite (have a very highly connected network) a geometric graph could be of use (this model randomly assign positions in a n-dimensional space and then place edges between nodes closer than a given distance). 

Is there already a random model?

According to our recent results we suspect there is no null model yet for PPIs, even though  for some virus PPIs some of the random models seem to be very good models; however this virus PPIs are much smaller (around 300 nodes and up to 500 edges) than the networks of model organisms (usually with more than 2000 nodes and 5000 edges) such as yeast, human, fruit fly and Escherichia coli among others.
We will soon be publishing our article with details about this.

Progress report: Molecular Dynamics simulations of TCRpMHC

Last time I gave a presentation about different papers describing Molecular Dynamics simulations of TCRpMHC (http://blopig.com/blog/?p=648&preview=true). This time I extended this to more of my own work. The focus of this talk was about the motivation why to choose a certain system and which requirements if must fulfíl for reliable conclusions. In short they are:

1) A larger number (>100) of experimental values (e.g. some kind of binding, immunogenicity, etc) of a certain TCRpMHC system. These values should be provided by:
– the same group
– the same HLA/MHC batches
– the same binding conditions
– in the ideal case in the same manuscript

The values should NOT be from a database since different experimental groups come to extremely different results for the same complexes as several examples show e.g.:
The binding IC50 affinity values of PKYVKQNTLKLAT to DRB1*01:01 range from 1nM and 600nM (IEDB entries).

2) Structural data exactly matching the systematic experimental data mentioned above. If multiple structures are involved they should be published by:

– the same group (in the ideal case even published together with the above mentioned data by the same group)
– be contemporary


Data which fulfil the above mentioned criteria is quite hard to find since most biologists are mainly interested in some fancy, however, rather anecdotal examples and rarely in systematic data production.

Once one has found such a system a large number of Molecular Dynamics simulations can be performed which will yield systematic differences not just differences originating from random events or data bias.


What is a kink?

If you ask someone who works with membrane protein structures what they think a helix kink is, you will probably get a fairly vague answer. They would probably tell you something like a kink is a point in the helix where there is a sharp change in the direction of the helix axis. Like the helix on the right in the picture.

A couple of helices

Two example helices


They might also tell you that they frequently (or always) involve Proline, and that they feature the absence of some of the backbone hydrogen bonds that you would otherwise expect to observe in a helix. But that is about as far as the consensus goes.

There are a number of published methods to identify kinks in helices (ProKink, Helanal, MC-Helan, and TMKink, to name a few). The detail of identifying kinks (and hence the definition of kinks) differs a lot between the methods. That would be fine if they all identified the same helices as having kinks, and the same positions in each helix as kinked, but they do not. Even the number of helices that are kinked differs a lot – anything from 6 to 60%. It would be easy if all α-helices were like the two in the figure – clearly kinked or straight. Generally the methods agree on these ‘easy’ helices. But there are lots of helices that are difficult to classify.

Why do we want to computationally identify them? Well, kinks are functionally important in membrane proteins. Membrane proteins are both medicinally important, and hard to experimentally determine the structure of. So, modelling their structures is a useful thing to do, and their structure includes kinks. But also, they are a structural motif. If we can write down what we think a kink is, use that definition to identify kinks, and then use information from those kinks we identified to (reliably) predict the existence of other kinks, we will know that we fully understand to motif.

There are a remarkably large number of perfectly sensible ways to identify a sharp change in the axis of an α-helix, given the coordinates of the backbone atoms.
The published methods (mentioned above) are a bit cumbersome (they require you to create input files, and parse at least one, if not many, output files), so from my experience people tend to make their own methods (That is not just me with Kink Finder, but many of the people who need to identify kinks that I have spoken to at conferences do not use a published method).

A short summary of ways to identify kinks:

  1. Fit axes to short sections of helix (4-8 residues). Give each residue an angle calculated from the angle between the axis of the section before it, and the axis of the section after it. If the largest angle in the helix is greater than a threshold, annotate the helix as kinked, at the residue with the largest angle
  2. Methods similar to (1), but using a measure other than an angle. For example, the curvature of a line fitted to the helix, or the distance between the ith and (i+4)th Cα residue
  3. Identify sections of the helix that are ‘straight’. Where a helix contains more than on section, it is kinked
  4. Look at them, and classify

Even for (1), there are lots of ways to calculate a helix axis. You can us least-squares (very sensitive to the number of residues used in the fit), or fitting to a cylinder (better, but slower), or a vector method using 4 Cαs. Similarly for (2), you could fit a spline, or just a polynomial. This is before you decide on (e.g.) how many residues you are going to fit axes to (6?, 7? 8?), or what smoothing parameter to use in the spline fit, or what order polynomial.

How should we classify this helix?

How should we classify this helix?

The point is, there are lots of ways to do it, but there is no consensus definition. You can use one method, or 2, or more, but they will give you different answers. Because we have no concise definition, it is hard to say which helix classification is ‘right’ and which one is ‘wrong’. Take this helix, it is not perfectly straight, but is it not straight enough to be kinked? Or is the change in axis over a number of turns, making it curved rather than kinked?

There are a few ways round this problem, where your computer program is struggling to ‘correctly’ classify helices. Rather than using a computer, you could manually curate a set, which has been done. However, there are a few issues here. First, their definition of a kink was a bit vague – and certainly difficult to turn into a computer program. Second, humans are very good at seeing patterns, even when they are not really there. Third, the end aim, at least for me, is to incorporate this into structure prediction, where a computational formulation of a kink is necessary. Another solution is to accept that your program is deficient, and put the borderline (i.e. difficult) cases into a third group, and removing them from your analysis. This does help to improve your signal, but is a little unsatisfactory.

To conclude, there are not two types of helices, there is more of a spectrum, from very straight, through a bit kinked, to very kinked. Classifying them is a hard problem, with lots a different approaches available. But, while the methods give different answers (particularly in identifying the position of the kink in the helix), and they do not indicate the same causes of kinks, there is work to be done.