
Generating low-energy molecular conformers is important for many areas of computational chemistry, molecular modeling and cheminformatics. Many tools have been developed to generate conformers, including BALLOON (1), Confab (2), FROG2 (3), MOE (4), OMEGA (5) and RDKit (6). The search algorithm implemented in these tools can be broadly classified as either systematic or stochastic. These algorithms primarily focus on generating geometrically diverse low-energy conformers. Here, we are interested in finding lowest energy conformation of a molecule instead of achieving geometric diversity and Bayesian optimization is used to find the lowest energy conformation (7). Continue reading
Category Archives: Cheminformatics
So, you are interested in compound selectivity and machine learning papers?
At the last OPIG meeting, I gave a talk about compound selectivity and machine learning approaching to predict whether a compound might be selective. As promised, I hereby provide a list publications I would hand to a beginner in the field of compound selectivity and machine learning. Continue reading
Mol2vec: Finding Chemical Meaning in 300 Dimensions

2D projections (t-SNE) of Mol2vec vectors of amino acids (bold arrows). These vectors were obtained by summing the vectors of the Morgan substructures (small arrows) present in the respective molecules (amino acids in the present example). The directions of the vectors provide a visual representation of similarities. Magnitudes reflect importance, i.e. more meaningful words. [Figure from Ref. 1]
A recent publication of one of my former InhibOx-colleagues, Simone Fulle, and her co-workers, Sabrina Jaeger and Samo Turk, shows how we can embed molecular substructures and chemical compounds into a similarly high-dimensional, continuous vectorial representation, which they dubbed “mol2vec“.1 They also released a Python implementation, available on Samo Turk’s GitHub repository.
Covariate Shift in Virtual Screening
In supervised learning, we assume that the training data and testing are drawn from the same distribution, i.e 
Methods such as Kernel Mean Matching (KMM) or Kullback-Leibler Importance Estimation Procedure (KLIEP) have been proposed. These methods typically assume the concept remain unchanged and only the distribution changes, i.e. 


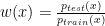
where 

Reference:
- Masashi Sugiyama ,Taiji Suzuki, Shinichi Nakajima, Hisashi Kashima, Paul von Bünau, Motoaki Kawanabe.: Direct importance estimation for Covariate Shift Adaptation. Ann Inst Stat Math. 2008
- Jiayuan Huang, Alex Smola, Arthur Gretton, Karsten Borgwardt, Bernhard Scholkopf.:Correcting Sample Selection Bias by Unlabeled Data. NIPS 06.
-
Mcgaughey, Georgia ; Walters, W Patrick ; Goldman, Brian.: Understanding covariate shift in model performance. F1000Research, 2016,
Seventh Joint Sheffield Conference on Cheminformatics Part 1 (#ShefChem16)
In early July I attended the the Seventh Joint Sheffield Conference on Cheminformatics. There was a variety of talks with speakers at all stages of their career. I was lucky enough to be invited to speak at the conference, and gave my first conference talk! I have written two blog posts about the conference: part 1 briefly describes a talk that I found interesting and part 2 describes the work I spoke about at the conference.
One of the most interesting parts of the conference was the active twitter presence. #ShefChem16. All of the talks were live tweeted which provided a summary of each talk and also included links to software or references. It also allowed speakers to gain insight and feedback on their talk instantly.
One of the talks I found most interesting presented the Protein-Ligand Interaction Profiler (PLIP). It is a method for the detection of protein-ligand interactions. PLIP is open-source and has a web-based online tool and a command-line tool. Unlike PyMol which only calculates polar contacts, and not the type of interaction, PLIP calculates 8 different types of interactions: hydrogen bonding, hydrophobic, π-π stacking, π-cation interactions, salt bridges, water bridges, halogen bonds, metal complexes. For a given pdb file the interactions are calculated and shown in a publication quality figure shown here.

The display can also be downloaded as a PyMol session so the display can be modified.
This tool is an extremely useful way to calculate protein-ligand interactions and can be used to find the types of interactions formed by the protein-ligand complex.
PLIP can be found here: https://projects.biotec.tu-dresden.de/plip-web/plip/