
OPIG /ooohhh pig/
acronym, also used as a noun
Oxford Protein Informatics Group; research group in the Department of Statistics at the University of Oxford focusing on aspects of protein modelling, homology modelling, membrane proteins, sequence alignment, antibodies and immunoinformatics, biological networks, and drug discovery.

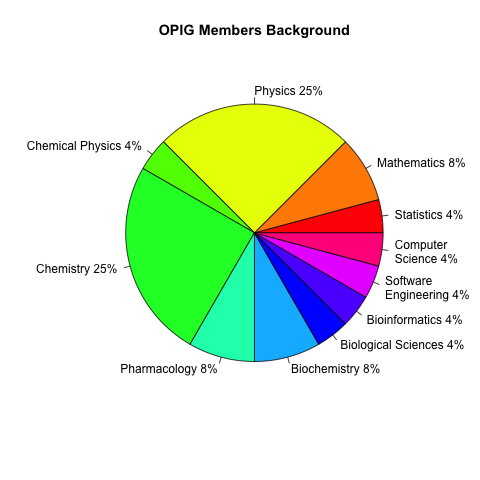
Headed by Prof. Charlotte M. Deane and Prof. Garrett M. Morris, the undergraduate backgrounds of our highly interdisciplinary 43-member team as of 10/07/2025 consists of:

Oh, did I mention we like pies? And cake? Lots of cake… And we also like computer code; so here is the R which generated the above beaut (original version from JP Ebejer).
# Pie Chart with Percentages
# OPIG members count, November 2021
x <- c(7, 1, 1, 1, 1, 1, 1, 8, 1, 1, 4, 1, 1, 1, 1, 1, 3, 1, 1, 1, 5)  # slices

# labels
labels <- c("Biochemistry", "Bioengineering", "Bioinformatics", "Biological Chemistry", "Biology", "Biomedical Engineering", "Biotechnology & Computer Science", "Chemistry", "Cognitive Science", "Computational Biology", "Computer Science", "Computer Science & Statistics", "Data Science", "Genetics", "Image Processing & Deep Learning", "Interdisciplinary Science", "Mathematics", "Mathematics & Statistics", "Nanobiology", "Pharmacy", "Physics")
#pct <- round(x/sum(x)*100)
#labels <- paste(labels, pct)  # add percents to labels
#labels <- paste(labels,"%",sep="")  # add % to labels


# save to file
png("opig_pie_2025.jpg", width=800, height=450); par(mar = c(0, 0, 0, 0))

# do the magic
pie(x, labels, main = "", clockwise=TRUE, col = rainbow(length(x)), radius = 0.8)
title(main = "OPIG Members' Background", line = -2)
dev.off()
More detailed information about each one of us can be found on our members official page.
—Original version of this page was prepared by former OPIG Member and now Prof. JP Ebejer. Latest update of this page was provided by Garrett M. Morris on 10 July, 2025.